OpenStereo in Action
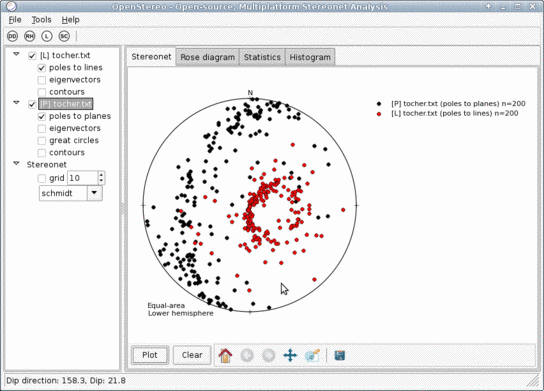
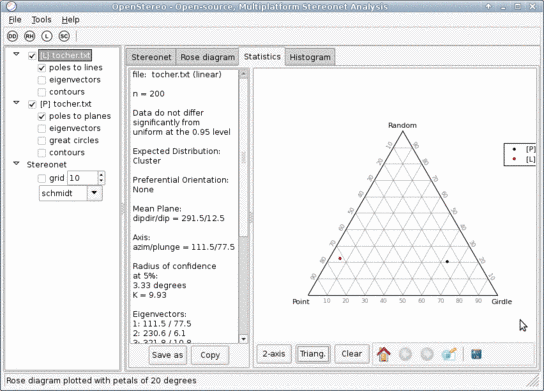
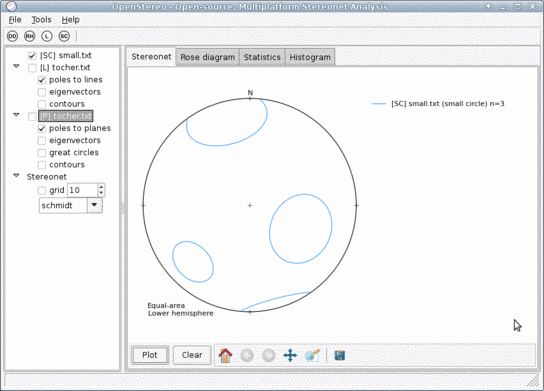
Main interface. Left panel: file tree Right panel: tabs for each operation (stereonet, rose diagram, statistics and histogram)
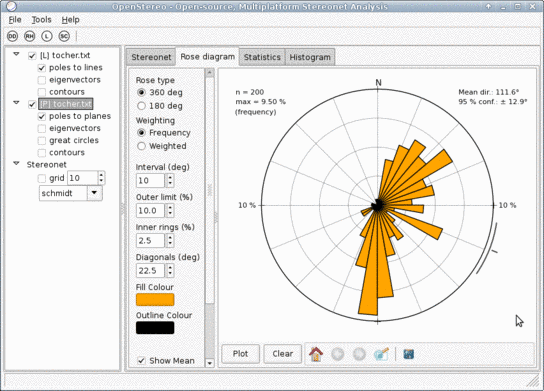
Rose diagram tab. Full rose (360 deg). 
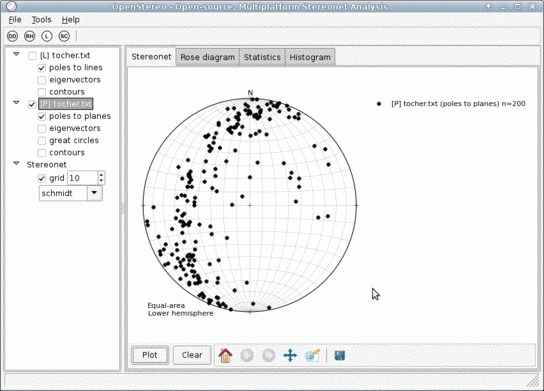
The highlighted file (left panel) is the one being ploted.
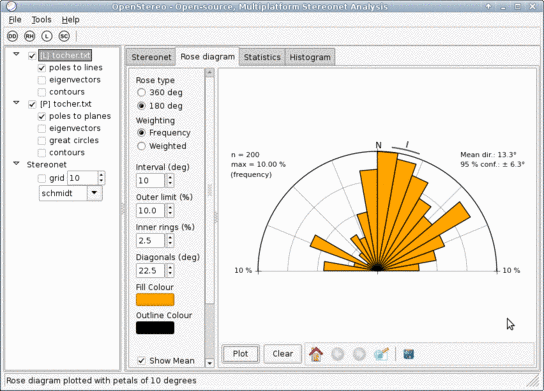
Rose diagram tab. Half rose (180 deg).
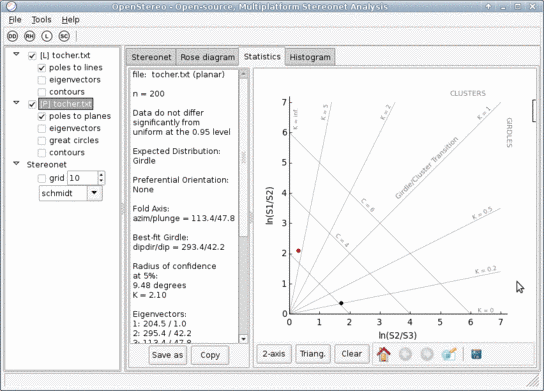
Statistics tab (1). The descriptive statistics are for the highlighted file. The text can be copied to the clipboard or save as a txt file. 2-axis (modified Flinn) diagram on the right. The color (and the symbols) are the same as those selected for the poles of the file.
Statistics tab (2). Triangular (Vollmer) fabric diagram.
Histogram tab. Histogram is ploted for the highlighted file. Data can be Dip Direction, Dip or Strike.
Contours. There are several options for counting grid density, colors, etc.
Great circles. The routine is very fast, even for large number of planes.
Small circles.
Grid. Equal-area (Schmidt) projection.
Grid. Equal-angle (Wulff) projection.
Right-click the name of the file to change properties or delete it. Double click calls properties dialog directly.
Properties dialog (1). Here it is possible to change all graphic properties for poles and great circles.
Properties dialog (2). Here the properties of contours are selected, like counting grid density, contouring method and graphic properties.
Color choose dialog.
Small circles have waaay less options…
Merge data tool. Select file to merge. The resulting dataset can be saved to disk or just appended to the file tree.